
Timeline of Systematic Data and the Development of Computable Knowledge


1600

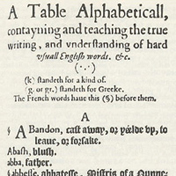
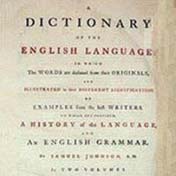
1604: A Table Alphabeticall
Organizing the English language
Robert Cawdrey publishes a dictionary with definitions for 2,543 terms.
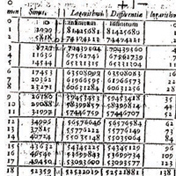
1614: John Napier
Multiplying numbers by simple addition
John Napier publishes the first tables of logarithms.

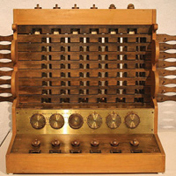
1623: Mechanical Calculator
Wilhelm Schickard creates a gear-based, wooden, six-digit, mechanical adding machine.

1627: Rudolphine Tables
Cataloging the known universe
Johannes Kepler's Rudolphine Tables lists the positions of 1,406 stars and procedures for locating the planets.

1637: René Descartes
René Descartes introduces coordinate systems to allow geometry to be studied using algebra.
1650

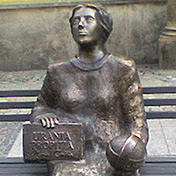
1650: Maria Cunitz
Maria Cunitz, a German astronomer, publishes Urania Propitia, which contains simplifications of Kepler's Rudolphine Tables.

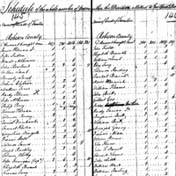
1654: William Petty
Taking stock of economic activity
William Petty, traveling with Cromwell's army, systematically surveys the profitability of land in Ireland.

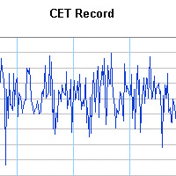
1659: Central England Temperature Record
Temperature every day
A record is started that continues today.
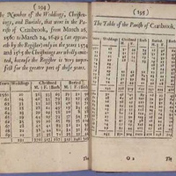
1662: John Graunt
Inventing the idea of statistics
Graunt and others start to systematically summarize demographic and economic data using statistical ideas based on mathematics.

1668: John Wilkins
John Wilkins suggests a "philosophical language" in which concepts are encoded by pronouncable phonemes.

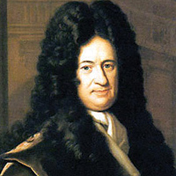
1684: Gottfried Leibniz
Answering questions using computation
Leibniz promotes the idea of answering all human questions by converting them to a universal symbolic language, then applying logic using a machine. He also tries to organize the systematic collection of knowledge to use in such a system.

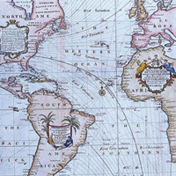
1686: Mapping the Winds
Edmond Halley creates a map showing prevailing winds at different locations.

1687: Isaac Newton
Mathematics as a basis for natural science
Newton introduces the idea that mathematical rules can be used to systematically compute the behavior of systems in nature.

1688: Joseph de la Vega
Prices in the stock market
Joseph de la Vega's book Confusion of Confusions describes fluctuations in Dutch stock market prices.
1700

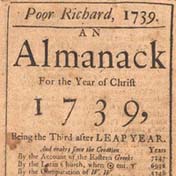
1732: Poor Richard's Almanack
Benjamin Franklin publishes the first edition of his popular yearly (1732–1758) almanac.
1750

1750: Creating a taxonomy for life
Carl Linnaeus systematizes the classification of living organisms, introducing ideas like binomial naming.

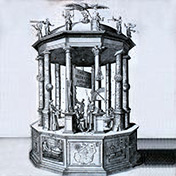
1753: British Museum
Collecting everything in a museum
The British Museum is founded as a "universal museum" to collect every kind of object, natural and artificial.

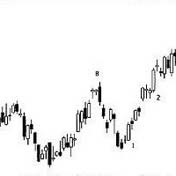
1755: Candlestick charts
Charting market prices
Munehisa Homma uses an early candlestick chart for prices in the Japanese rice market.


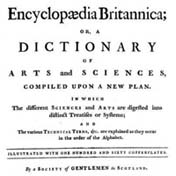
1768: Encyclopædia Britannica
The Encyclopædia Britannica—and the Encyclopædie of Diderot and d'Alembert—attempts to summarize all current knowledge in book form.

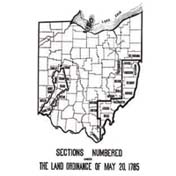
1785: US Land Ordinance; British Ordnance Survey
Mapping whole countries
The US (1785) and UK (1791) governments begin creating detailed systematic maps of their countries.
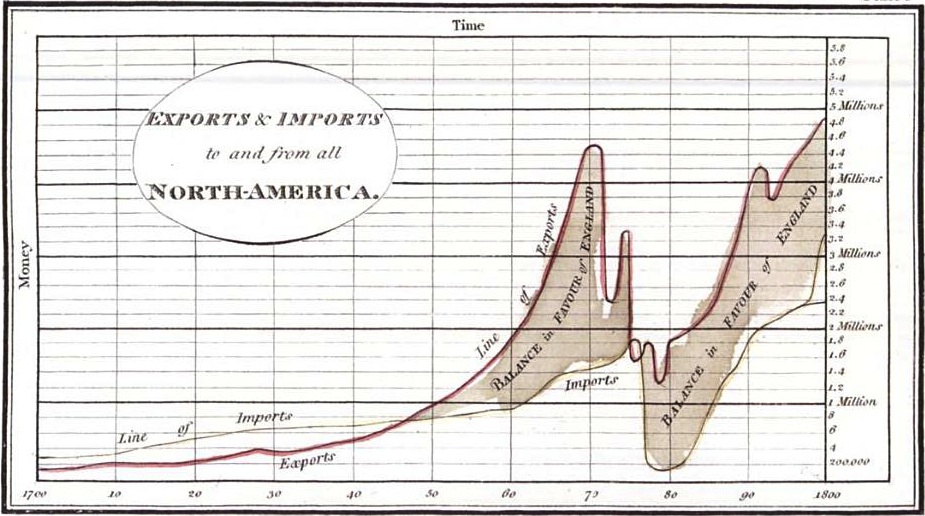
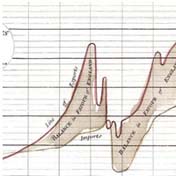
1786: Pie Charts, or Commercial and Political Atlas
William Playfair's Commercial and Political Atlas graphically illustrates socioeconomic dates and invents the pie chart.

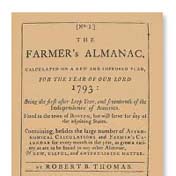
1792: Farmer's Almanac
Robert Bailey Thomas begins publication of the still-extant Farmer's Almanac.

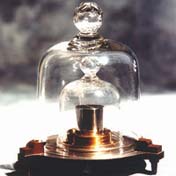
1795: The Metric System
Everything is decimal
France becomes the first nation to officially adopt the metric system of measurement.

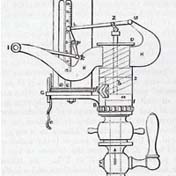
1796: Recording data by machine
James Watt and John Southern create (but keep secret for 24 years) a device for automatically tracing variation of pressure with volume in a steam engine.
We're continuing to update this timeline... Do you know some history we don't?
![]() We want your input »
We want your input »